
I mentioned last week that caution should be applied to the stock market rally as the 20% plus moves seemed to be running out of steam. The S&P500 has retraced back below the important 805 level with a negatively biased RSI and imminent MACD downside cross over on the daily charts. The technical indicators provide a clear signal that markets should move lower very quickly but with the G20 meeting in progress the "invisible hand" may have other ideas.
The FTSE 100 last night filled an overhead gap and reversed to the downside a very bearish signal. It has also completed a Fibonacci 61.8% retracement of the down move that began in early February. Watch the 3750 level if this breaks we will likely to see a re test of the recent lows.
FTSE100 Daily (click on chart for larger view)
The next few days will be critical for many markets.
The chart patterns indicate downside bias for the FTSE100,S&P500 and the Australian dollar. Alternatively upside bias for gold and silver.
A reminder that "announcement volatility" is high for most markets right now, in particular gold, and as such can have significant short term influence on markets.
For example there was much chatter leading into G20 about the IMF selling gold reserves to fund developing nations but in contrast Russia and China are calling for a new world reserve currency basket which would include gold. I guess my warning here is be very careful about short term trading, instead focus on the longer term fundamentals and use the volatility to build strategic investments.


Back in early March we called for a big stock market rally of about 20%. From the low point on March 6th of 666 on the S&P500 to yesterdays high of 800, we have seen a 20.1% rally. Given the dramatically oversold nature of stocks at the time it wasn't that hard to predict the rally. However what happens next is far more difficult.
Our original forecast was for a 20%+ rally with a big sell off from mid to late April with new lows in October/November. We stick by this forecast but caution you that the duration of the rally may not last until April and a sharp correction or even crash may be imminent.
Lets look at the charts to understand why:
S&P500 long term back to 1982 with Fibonacci levels
As you can see todays close of 766 is right on the 2002/2003 double bottom low. If it does not hold this level we will see a break of the recent 666 low. The fibonacci level of 638 is the next obvious support but if this breaks there is no major support until 444 a whopping 42% under todays close. Again I state that my forecast is not 444 but you should be aware that it is a possibility in a panic sell off.

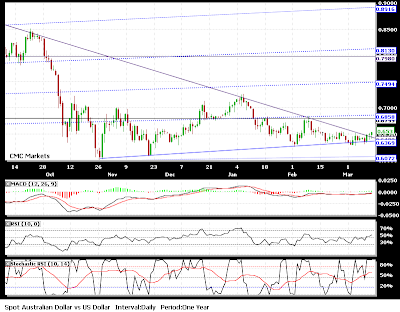
The AUD/USD has confirmed yesterday's upside breakout of the declining wedge pattern in place since last September. If the AUD can hold and move away from .6488 we should see a test of .6800 in quick time. However, strong resistance exists at .6800 and .7200. The Australian dollar is a good proxy for global growth and risk appetite, a strong breakout also bodes well for continued short term stock market strength. Despite the more positive short term outlook, systemic issues in the financial, economic and political landscape have not disappeared, they are actually getting worse. Any rally in risk related assets such as AUD and the stock market is likely to dissipate by May. Trade for short term profits selling in to strength through April.
Silver USD weekly (click on chart for larger view)

Gold USD weekly (click on chart for larger view)

Gold in Australian Dollars
The Australian dollar moved in tandem with gold this week meaning little change from last weeks close. Importantly it held the $1226 level to close at $1230. Whilst the technical set up is not as bullish for gold in AUD the current distribution pattern is a healthy sign that normally results in a continuation of the preceding trend. That means up. After checking the AUD/USD FX charts today I cant see a break much beyond 0.72 (based on long term technical resistance) so if this were to hold and gold hit USD $1000 by year end our long standing $1400 Gold in AUD target remains achievable. Even if it does not reach our target by Dec 31st it wont be long into 2009 before we see $1400 and higher.
Gold AUD weekly (click on chart for larger view)

Bullionmark now publishes live and interactive charts for all the key gold and silver metrics. You can find them on the menus under "chart centre" or on the following links:
Spot Gold
Spot Silver
Gold to Silver ratio
Silver to Gold ratio
Dow Jones to Gold ratio
Dow Jones to Silver ratio
XAU gold and silver stock index
Australian dollar spot
With 10% swings in opposite directions in the last two weeks precious metals have shown why they are not for the faint hearted investor. The anticipated MACD cross over occured in both gold and silver on Tuesday sparking a strong rally.
Silver in USD
Silver recovered all of last weeks drop with an 11% rally. Again the $10.60 level proved strong resistance with price dropping back to $10.27 by Fridays close. With four tests of the $10.60 level behind us and a weekly MACD cross over now in place I expect a break out for silver as soon as next week. As previously stated any break will be powerful. Expect a brief pause at $11.43 and a then a fast move to my year end target of $13.66. Major downside support remains at $8.93.
Silver in USD (Click on image for larger chart view)
Gold in USD
Gold gained about $70 or 9.3% for the week to settle at $822, right on the 50 day moving average. $830-$850 remains strong resistance but the technical set up remains extremely bullish for a break out as early as next week. With last weeks washout now behind us I remain committed to a target of around $1000 by year end. My expectation of a near 20% rally inside two weeks shows how bullish the technical set up is right now. On the downide $770 remains key support.

Gold in USD (Click on image for larger chart view)

Gold in AUD
In AUD terms gold held the key support level of $1168 and rallied to close at $1236, just above the 50 day moving average. whilst the technical set up for gold in AUD terms is less bullish than USD, I still expect $1400 gold by year end. Support remains $1226 (weak) and the $1168 (moderate).
Gold in AUD (Click on image for larger chart view)
As a long term gold and silver investor I am getting a little tired of the same old play book. Just when the fundamentals and technicals look most bullish for gold and silver and most bleak for the economy and the US dollar, in steps the invisible hand. The take down of gold for 7% and silver almost 10% on Monday with no news, no move in the dollar is almost unbelievable. However hitting the gold price ahead of major economic releases has been the modus operandi for all eight years of this bull market. You could have predicted a worse than expected jobs number in the US on Friday by how hard gold was smashed on Monday. This makes little difference in the medium to longer term but it is very frustrating when trying to trade the market on a short term basis. If you wish to learn more about the blatant market manipulation in gold and silver I suggest you go to GATA.org or watch these videos.
The good news is that the strong technical base is still in place for both gold and silver. The take downs breached medium level resistance in silver at $10 but the more significant resistance of $8.93 silver still remains in tact. Weekly MACD will record a cross over very soon and the divergence of RSI and price trends remain very bullish. Despite the big losses this week my forecast for $13.66 by year end remains. $10.60 is still the key upside resistance but if we can break this decisively expect a brief pause at $11.39 but from there its straight to $13.66. Time is now working against my forecast but those of you who understand the silver market will understand how quickly the price can move. $8.93 remains as support. A breach of this level on a weekly basis would be very significant and undermine the validity of the bull market which began in 2001.
Silver weekly in USD (click on image for larger view)
Last week the technical set up for gold was the best it has been since 2001. Unfortunately thats all the motivation the invisible hand needed to get involved. Their coordinated action on Monday has done considerable short term damage. Whilst am confident that the MACD cross over will still occur in coming days (and therefore rectify the short term damage), the decisive break below the key resistance of $770 is worrying for short term price action. It is not my forecast but there is a small possibility we could see a retest of the recent lows next week. Retest or not, my call is still back to the $1000 level by years end. However for the short term traders out there I need to highlight the risks in this forecast have increased. Long term investors need not worry the bigger picture has not changed.
Gold weekly in USD (click on image for larger view)
Gold in Australian dollar terms breached the short term resistance of $1226 and settled right on the key resistance of $1168. We need to hold $1168 or we will drop back to the $1040-$1060 area fairly quickly. I remain cautiously bullish with an upside target of $1400. My bullish bias would not change unless we decisively break $952 on a weekly closing basis.
Gold weekly in AUD (click on image for larger view)


Silver
Despite failing to hold the $10.60 level last week, the silver technicals remain positive. The weekly MACD should see a cross over next week or the week after. This heavily used indicator should bring many momentum traders back into silver. $10.60 remains upside resistance but if we can break this decisively expect a brief pause at $11.39 but from there its straight to $13.66. The $10 range remains good support on the downside.
Silver in USD weekly (click on chart for larger view)
Gold
The $825 range remains strong resistance for gold. However, like silver, the MACD set up is extremely bullish. The cross over for gold likely to occur very soon. MACD cross overs from very low levels supported uptrending RSI and declining price is one of the most bullish technical set ups you can have. It is my view that gold will break resistance at $825 this week and head to $880 immediately. If the range breakout occurs we should see a retest of the all time highs of $1034 before Christmas.
Gold in USD weekly (click on chart for larger view)
Gold in Australian dollars
It is not widely publicised but gold is hitting record highs against the Euro, Swiss franc, South African Rand, Canadian dollar, British pound, NZ dollar and the Australian dollar. In fact year to date gold is up 29% in Australian dollar terms. Given stocks are down 40-50% over the same period gold is a stand out. Whilst a rise in the Australian dollar could limit the near term upside the technical picture is still very constructive. We have tested and failed at the $1300 resistance several times in recent weeks. With a good support now at $1226 I believe the next move up will break this resistance and move quickly to $1415.
Gold in AUD weekly (click on chart for larger view


As forecast the bullish bias on both gold and silver materialised last week. The levels of $1168AUD for gold and $9.60USD for silver now become important levels of support. Some retest of these levels may be seen early next week but the path of least resistance is up from here.
Gold weekly (in $AUD) click on chart for larger view
Our short term targets forecast last week were achieved. Should gold break above $1300AUD we will see a quick move to $1415. An impulsive move could see $1450AUD a point of very strong resistance. Good support is now in place at $1150AUD.
Silver daily (in USD)click on chart for larger view
Silver tested and held our $8.93 resistance levels this week. The predicted bounce to $9.60USD was achieved with Fridays strong rally. Strong closes on a Fridays are a bullish signal. With the $9.63USD target achieved it should now provide solid support. We expect a run to $10.50USD this week with a breakout target of $13.50USD soon. Big moves may be coming for silver.


This weeks technicals generally look more positive for gold and silver. This risk to the downside is fairly limited and we seem to be building a constructive base for a large move higher.
Gold weekly (in $AUD) click on chart for larger view
In Australian dollar terms the gold technicals are very bullish. Last week we tested resistance at $1076 and have bounced nicely to $1150. A break of $1168 could see $1225 very quickly.
Gold daily (in AUD) click on chart for larger view
The daily chart shows how gold has regained its uptrend from mid September. $1142 should hold some resistance next week.
Silver weekly (in USD)click on chart for larger view
We can see that silver is again holding its uptrend support from October 2001. $8.93 is a critical level to hold.
Silver daily (in USD)click on chart for larger view
The daily chart shows some short term strength and if next week we can break the $9.60 downtrend line we could see a rapid move to $10.50.


 Posts
Posts

